In the ever-competitive realm of digital marketing, backlinks stand as a cornerstone of SEO success. Among various strategies to earn these valuable links, infographics have emerged as a potent tool. They blend informative content with visual appeal, making them attractive for both audiences and link-building. This guide will explore how you can leverage infographics to enhance your backlink profile, bolstering your website’s SEO.
Before you begin creating your infographics
Before you begin creating your infographics, it’s important to identify keywords and topics that are popular and relevant in your niche. Tools like Google’s Keyword Planner can help identify terms with high search traffic. Aim for keywords related to “facts,” “stats,” “statistics,” or “trends” in your area.
Additionally, Understanding your target audience is crucial. Determine what information they seek, their preferences, and the kind of visual content that resonates with them. This step ensures that your infographic will be relevant and valuable to those who view it.
Tips For Creating Your Infographics
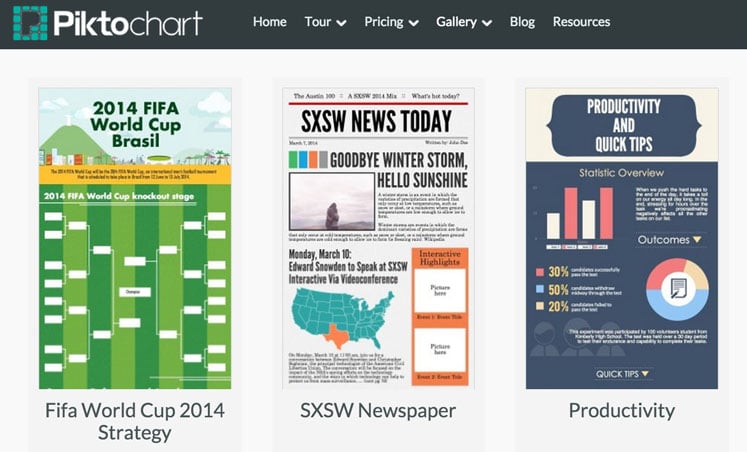
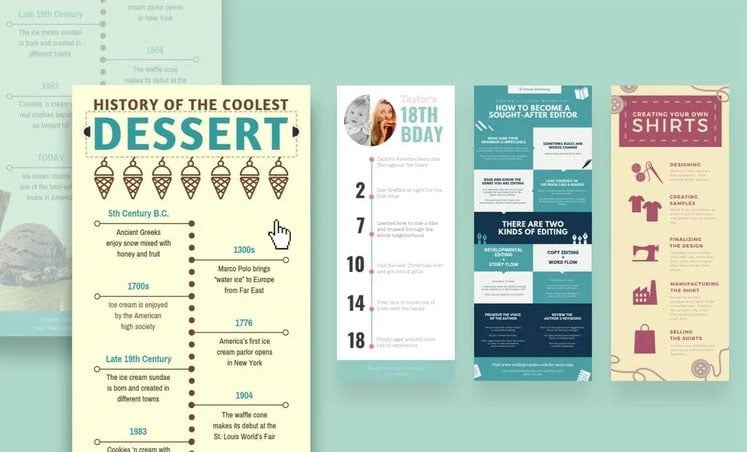
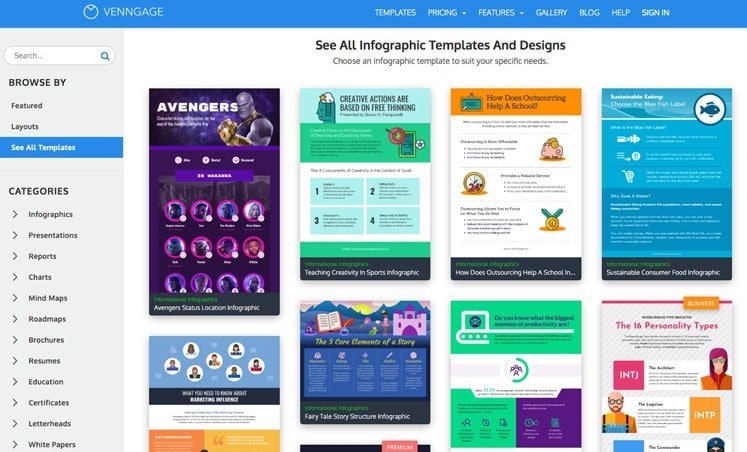
- Designing Quality Infographics: Use tools like Canva or Piktochart for user-friendly design templates. Focus on creating visuals that are both appealing and informative. Remember, the design should complement the data, making complex information accessible and engaging.
- Content Is King: The information should be accurate, relevant, and offer real value. Ensure the data is up-to-date and sources are credible. An infographic that provides unique insights or fresh data is more likely to be shared and linked to.
Modern Infographic Backlink Strategies: How to Create Link-Worthy Content
1. Quantity Doesn’t Improve SEO
Prioritise the quality and relevance of your infographics over mere quantity. Well-researched and data-rich infographics that provide real insights or solutions are more likely to garner backlinks, as they are seen as valuable resources in their respective fields.
2. Make Your Content Easy to Consume
Simplify the complex information with clear, straightforward designs and concise text. Utilise tools like Canva and Piktochart for professional and engaging visuals, making your infographics more shareable and link-worthy.
3. Know Where to Post Your Infographics to Help Building Backlinks
Research and identify the platforms where your target audience is most active. Tailor your posting strategy to these platforms, enhancing the visibility and shareability of your infographics.
4. Make Dynamic, Interactive Infographics
Elevate your infographics by incorporating interactive elements. Interactive infographics engage users more effectively, encouraging them to spend more time with your content and increasing the likelihood of shares and backlinks.
5. Strategically Distributing Your Infographics
- On Your Website: First, host the infographic on your site as this will be the backlink’s destination. Accompany it with a well-written post or page that expands on the infographic’s content, targeting the high-traffic keyword identified earlier.
- Embed Codes: Simplify the sharing process by providing an embed code directly below the infographic. This code should include the infographic’s image file, desired anchor text, and the target URL for backlinks.
- Infographic Submission Sites: Utilise platforms dedicated to sharing infographics. Some may be free, while others might charge a nominal fee. This exposure can lead to more backlinks as people discover and share your content
6. Amplifying The Reach of Your Infographics
- Social Media and Influencers: Share your infographic on social platforms. Tag or notify influencers in your industry who might find your content valuable and could share it with their followers, amplifying its reach and potential for backlinks.
- Email Outreach: Identify and reach out to website owners with content relevant to your infographic. Offer them the content as a valuable resource for their audience, and in return, ask if they could link back to it.
7. Advanced Techniques for Backlink Building
- Guest Blogging: Offer to create guest posts for relevant sites. In these posts, incorporate your infographic and a link back to your site.
- Press Releases: Announce your infographic through a press release. Optimise it with relevant keywords and include a backlink to the page hosting the infographic.
- Design Feedback Sites: Share your infographic on design feedback platforms to garner organic backlinks and constructive feedback.
Leveraging Guestographics Into Your Link Building Strategy
Guestographics are infographics specifically designed for use on another website. You create a valuable, relevant infographic and offer it to a high-ranking site in your niche. In exchange for this valuable content, you request a backlink to your own site. This mutual exchange benefits both parties: the hosting site receives quality content to engage their audience, and you receive a high-quality dofollow backlink, boosting your SEO. It’s a collaborative effort that enhances the value for both websites and their audiences.
Is Link Building with Infographics Still Effective?
Address common concerns about the evolving effectiveness of this strategy, showcasing recent success stories and statistics to demonstrate its continued relevance.
How we can help
Struggling to enhance your link-building campaign? Our experienced team of SEO experts specialises in various aspects of SEO, including creating and implementing effective link-building strategies tailored to your business needs. With our expertise, we can help elevate your online presence and drive more organic traffic to your site. Don’t wait to improve your online visibility; contact us today and take the first step towards a more visible and successful online presence for your business.
Further reading:


